What will the global meat industry look like in 2031? Part 5: Summary
This is part 5 of a series of 5 Blogs.
2022-31 Projections for Meat Consumption, Production, and Trade by Country and Type of Meat
Using the OECD-FAO Agricultural Outlook’s most updated database (edition 2022), the EMEAT Market Analysis Team has prepared a detailed analysis by type of meat and country for key indicators such as total and per capital consumption, production, and trade (imports/exports).
Using the Easy Analytics approach that characterizes EMEAT, we have been able to condense large amounts of data into a few easy-to-understand charts.
Contents
| 1. Scope |
| 2. Analysis for All Major Types of Meat |
| 3. Analysis for Poultry Meat |
| 4. Analysis for Pigmeat |
| 5. Analysis for Beef and Veal |
| 6. Analysis for Sheepmeat |
| 7. Sources |
1. Scope
This analysis includes projections for the years 2022-31 for meat consumption, production, and trade (import/export).
The types of meat included are: poultry, pigmeat, beef and veal, and sheepmeat.
The analysis is also done by country, for the 34 countries included in the OECD-FAO Agricultural Outlook 2022-2031 database.
2. Analysis for All Major Types of Meat
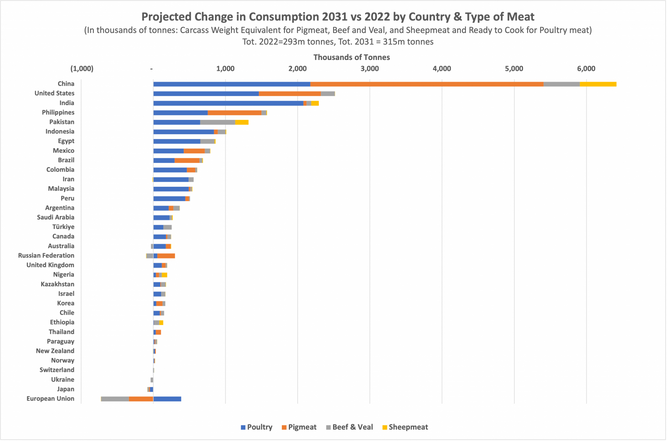
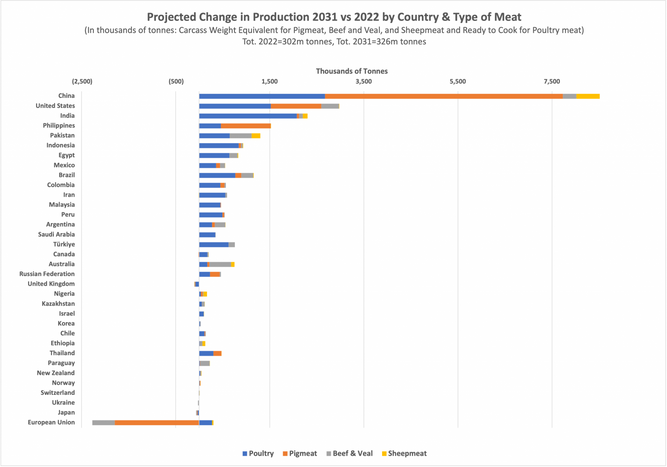
Poultry is the meat type projected to have the highest growth (+13m tonnes), followed by Pigmeat (+6m tonnes), Beef & Veal (+1.9m tonnes), and Sheepmeat (+1m tonnes).
Most growth in meat consumption is projected to come from China (+6.4m tonnes): +3.2m tonnes from Pigmeat, +2.2m tonnes from Poultry meat, +500K tonnes from Beef & Veal, and +500K tonnes from Sheepmeat.
For most countries, Poultry is the meat type with the highest forecasted growth.
The European Union is projected to have the steepest decline in meat consumption (-341K tonnes), with significant consumption reductions in Beef & Veal (-386K tonnes) and Pigmeat (-338K tonnes), but with some growth in Poultry (+386K tonnes).
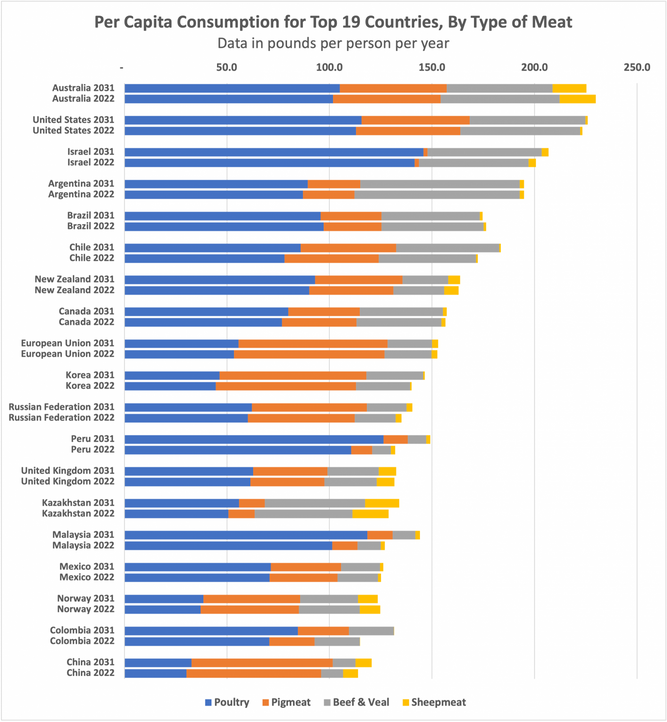
Significant per capita consumption changes include:
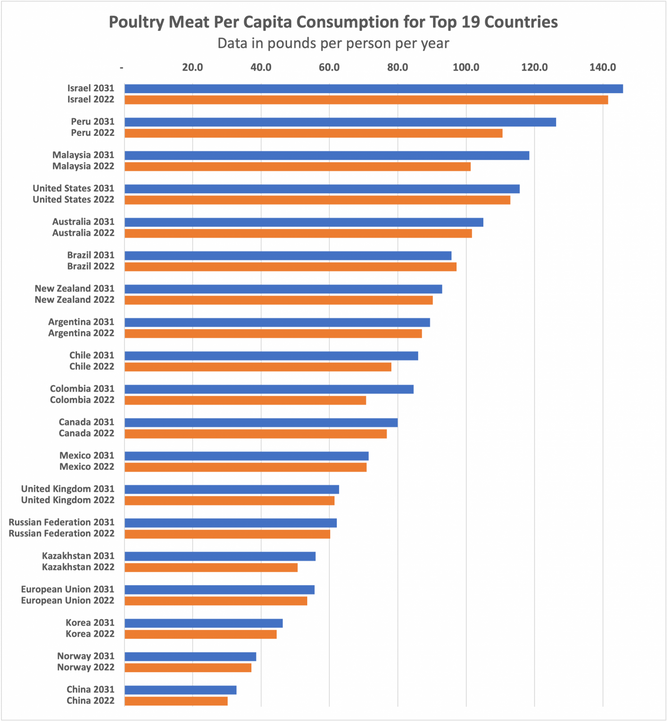
- Poultry: Malaysia, +17.2 Lbs; Peru, +15.7 Lbs; Colombia, +13.9 Lbs.
- Pigmeat: Russian Federation, +4.0 Lbs; Korea, +3.2 Lbs; China, +3.1 Lbs; Colombia, +2.9 Lbs.
- Beef and Veal: Australia, -6.6 Lbs; Argentina, -2.9 Lbs.
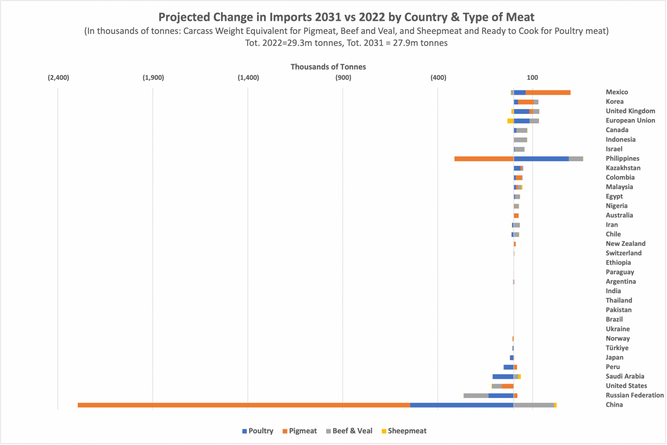
China is expected to experience the largest changes in import demand with -1.8m tonnes for Pigmeat and -545K tonnes for Poultry, driven by China’s massive increases in production of these animal proteins: +5m tonnes for Pigmeat and +2.7m tonnes for Poultry meat.
Other countries with significant production growth include the U.S. with +3 million tonnes (mostly Poultry and Pigmeat), India with +2.3 million tonnes (mostly Poultry), the Philippines, Pakistan, and Brazil.
The European Union is projected to lose 2 million tonnes of production, mostly of Pigmeat.
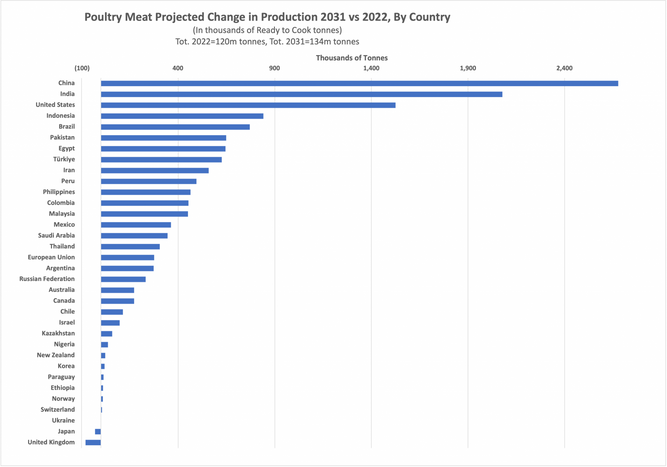
3. Analysis for Poultry Meat
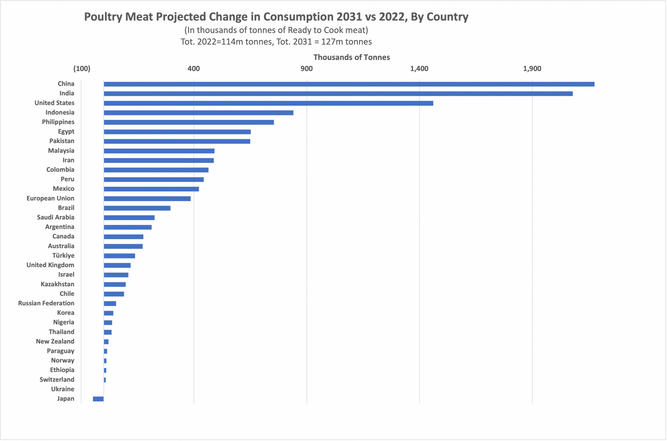
Of the total expected growth in consumption (+13m tonnes), the countries with the largest contributions are China (+2.2m tonnes), India (+2m tonnes), and the United States (+1.5m tonnes).
Countries with large projected changes in per capita consumption include Malaysia (+17 Lbs), Peru (+16 Lbs), and Colombia (+14 Lbs).
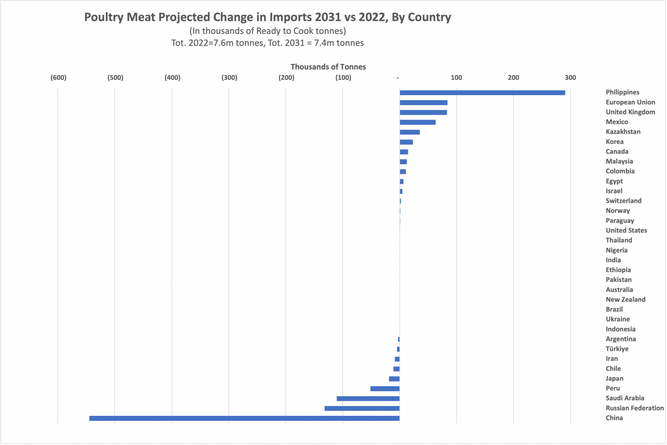
On the trade side, the country with the largest expected increase in imports is the Philippines (+290K tonnes). The country with the largest projected decrease in imports is China (-545K tonnes).
Increases in production are driven by China (+2.7m tonnes), India (+2m tonnes), and the United States (+1.5m tonnes).
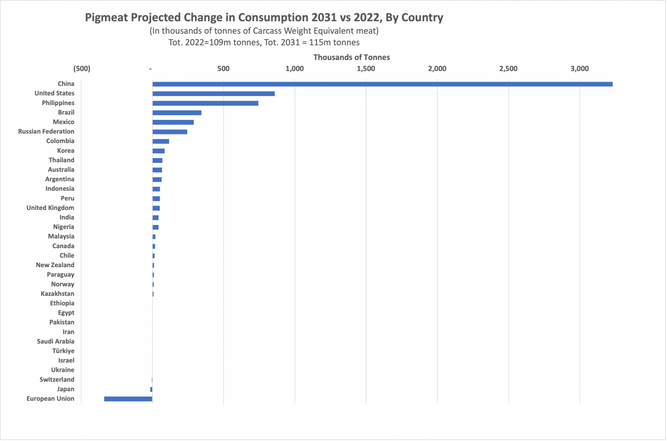
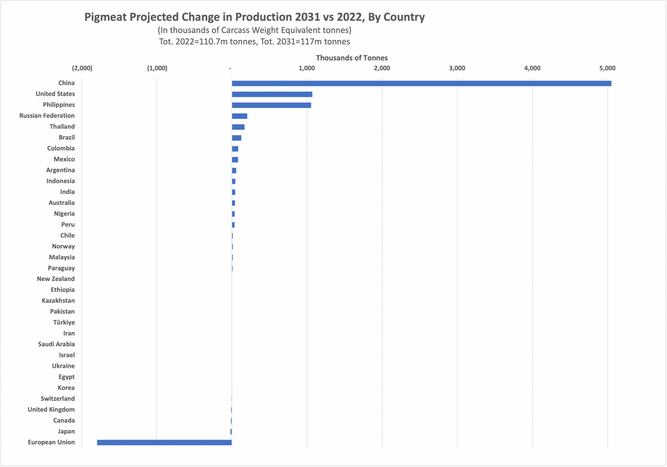
4. Analysis for Pigmeat
Of the total expected growth in consumption (+6m tonnes), the countries with the largest positive contributions are China (+3.2m tonnes), the United States (+860K tonnes), and the Philippines (+750K tonnes). The European Union is the only market with a large expected consumption reduction (-340K tonnes).
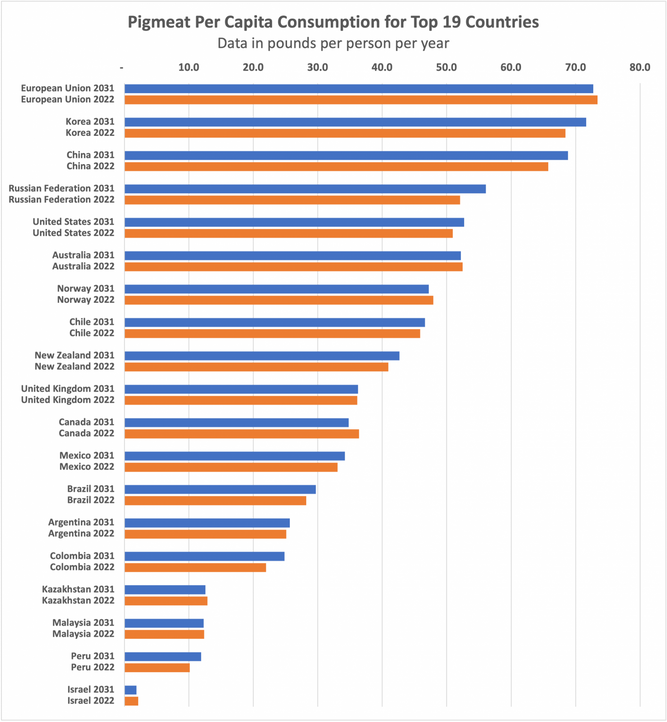
Countries with large projected changes in per capita consumption include the Philippines (+8 Lbs), the Russian Federation (+4 Lbs), Korea (+3.2 Lbs), China (+3.1 Lbs), Colombia (+2.90 Lbs), Canada (-1.6 Lbs), and Switzerland (-2.9 Lbs).
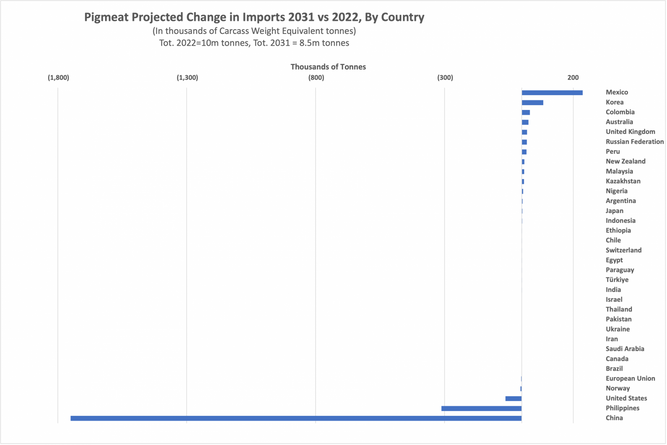
On the trade side, the country with the largest expected increase in imports is Mexico (+236K tonnes), and the ones with the largest projected reductions in imports are China (-1.8m tonnes) and the Philippines (-312K tonnes).
Increases in production are driven by China (+5m tonnes), the United States (+1m tonnes), and the Philippines (+1m tonnes).
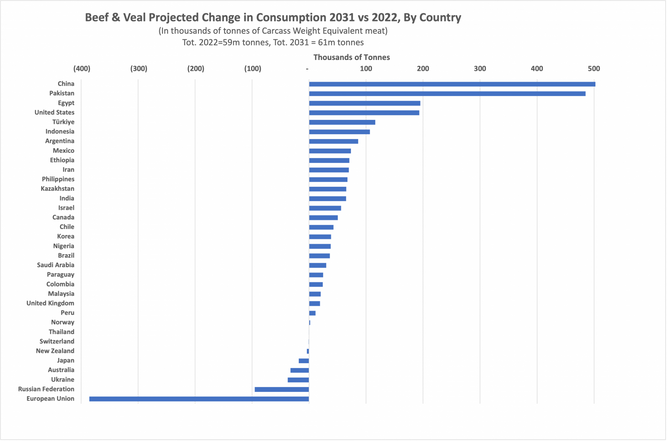
5. Analysis for Beef & Veal
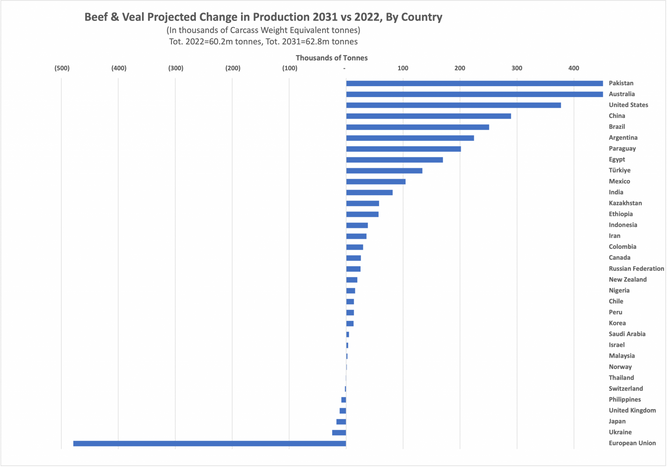
Of the total expected growth in consumption (+1.9m tonnes), the countries with the largest positive contributions are China (+500K tonnes) and Pakistan (+490K tonnes). The European Union is the only market with a large expected consumption reduction (-390K tonnes).
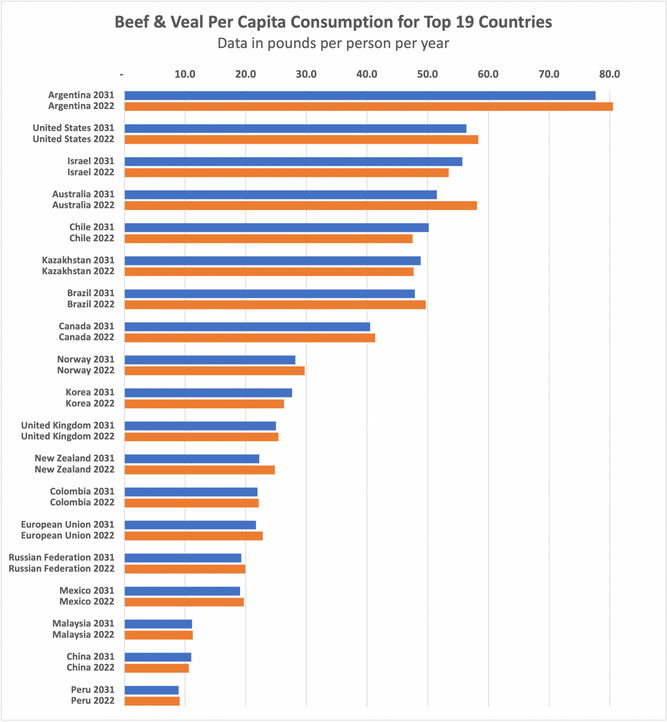
Countries with large projected changes in per capita consumption include Chile (+2.7 Lbs), Israel (+2.25 Lbs), New Zealand (-2.6 Lbs), Argentina (-2.9 Lbs), and Australia (-6.6 Lbs).
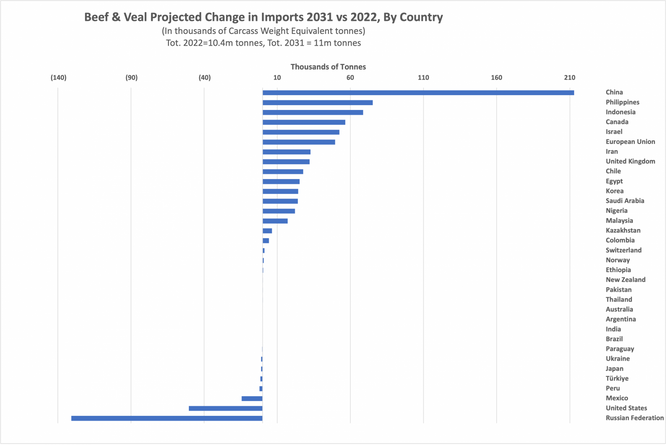
On the trade side, the country with the largest expected increase in imports is China (+213K tonnes), and the one with the largest projected reduction in imports is the Russian Federation (-131K tonnes).
Increases in production are driven by Pakistan (+470K tonnes), Australia (+470K tonnes), and the United States (+380K tonnes). The largest decrease in production is expected to come from the European Union (-480K tonnes).
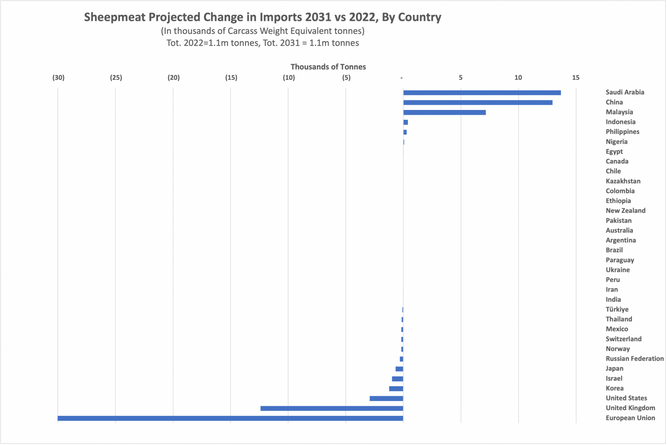
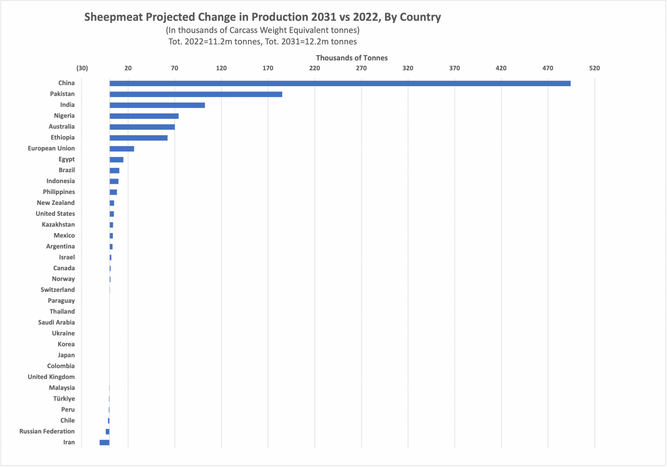
6. Analysis for Sheepmeat
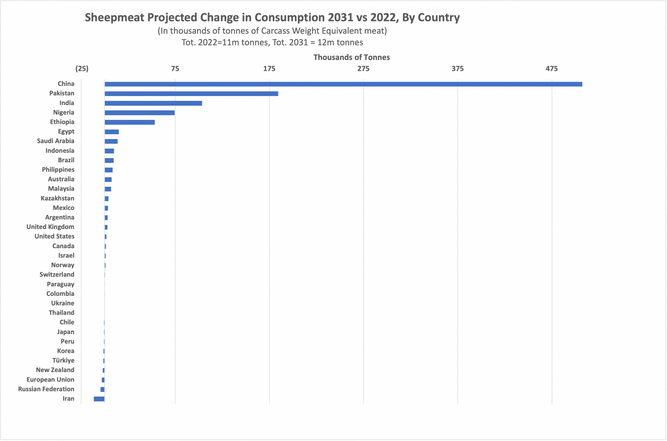
Of the total expected growth in consumption of almost 1m tonnes, the countries with the largest positive contributions are China (+510K tonnes), Pakistan (+180K tonnes), and India (+100K tonnes).
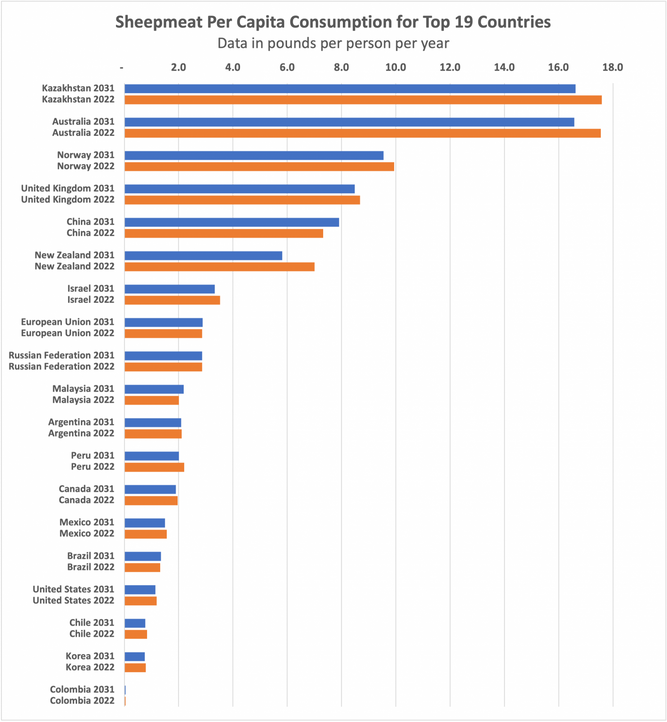
Countries with large projected changes in per capita consumption include Australia (-1 Lbs), Kazakhstan (-1 Lbs), and New Zealand (-1.2 Lbs).
On the trade side, the countries with the largest expected increase in imports are Saudi Arabia (+14K tonnes), and China (+13K tonnes). The market with the largest projected reduction in imports is the European Union with -30K tonnes.
Increases in production are driven by China (+490K tonnes), Pakistan (+185K tonnes), and India (+102K tonnes).
Prepared by the EMEAT Market Analysis Team
contact@emeat.io
7. Sources
OECD-FAO Agricultural Outlook 2022-2031 database
Database published: July 2022
https://www.oecd-ilibrary.org/agriculture-and-food/data/oecd-agriculture-statistics_agr-data-en
Beef
Pork
Poultry
Sheep
Questions about this Article?:
Sign Upto comment

The EMEAT Team
Sales, Purchasing, RiskManagement
We simplify data analysis and interpretation with user-friendly, affordable, and customizable tools. Our market data, analytics, and insights empower everyone in the North American meat industry, from ranchers, feedlot operators, and meat packers to retailers and food service companies.
Sign Up and enjoy full access to EMEAT
Complete market data, advanced analytics, forecasting and risk management tools at your fingertips for 14 days. Don't miss the opportunity to explore EMEAT's full potential!
no payment information required


Copyright © 2021-2025. All rights reserved
This website stores cookies on your computer. These cookies are used to collect information about how you interact with our website and allow us to remember you. We use this information in order to improve and customize your browsing experience and for analytics and metrics about our visitors on this website. To find out more about the cookies we use, see ourPrivacy Policy.