

Market Data, Analytical Tools, and Insights for the North American Meat Industry
or
Also available on:

About EMEAT
We provide market data, analytics, content, and insights tailored to the North American meat industry.
By simplifying data analysis and interpretation with user-friendly, affordable, and customizable tools, we empower stakeholders across the value chain, including cattle ranchers, feedlot operators, packers, processors, distribution companies, restaurant chains, and retailers.

Gain access to up to six years of historical data of the U.S. market with easy analytics tools.

Anticipate beef & pork price movements with our Price Forecasting and Packer Margin analyses tools.

Go to our News & Blogs, and Events sections to stay informed about the industry's latest developments.

Receive the latest news and price data via our Daily Bulletin, Weekly Commodity Recap, and Weekly Newsletter directly to your mailbox.

Find the products & services you are looking for in our recently launched, multimedia-rich, and Bus. Directory.
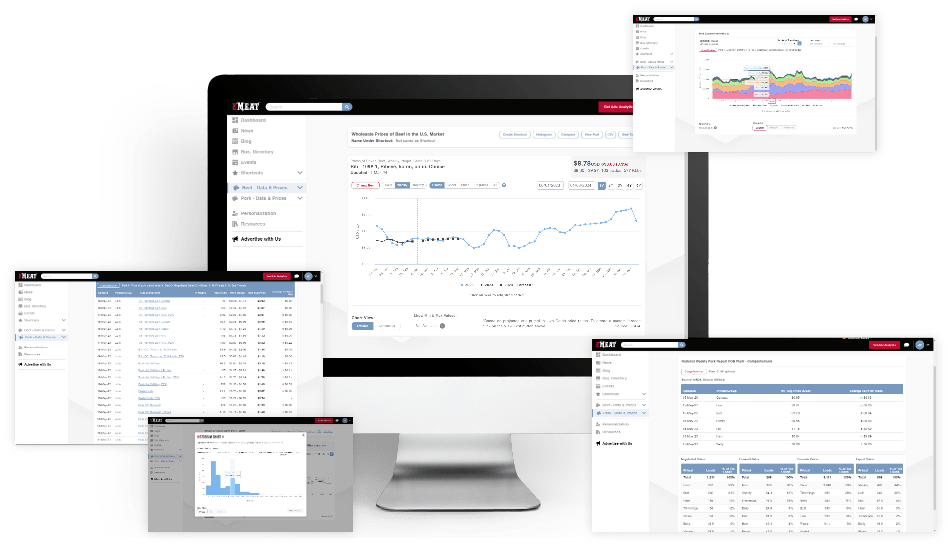
FREE MARKET DATA SUITE
Get easy-to-use market data and analytics from the last 12 months to help you make informed decisions and stay competitive:
- Prices Of Meat
- By-Product Drop Value
- Supply & Demand Data
- Prices of Livestock


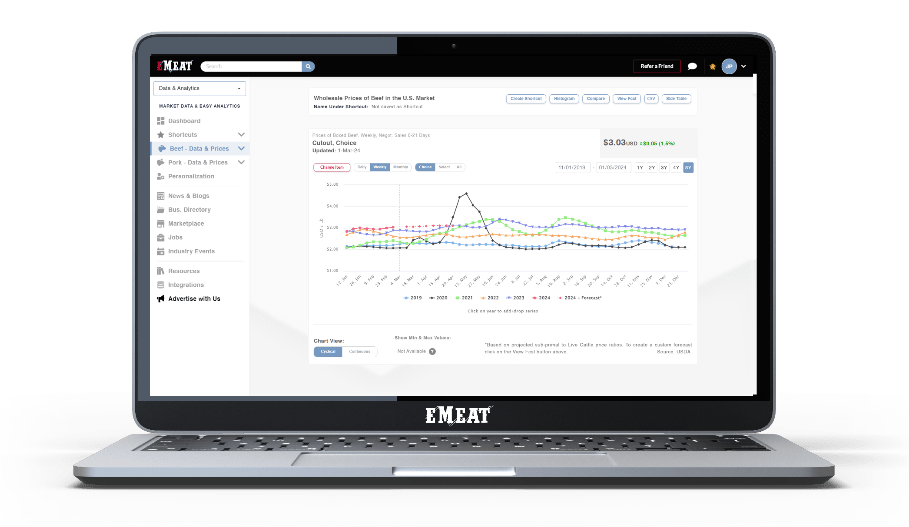
EASY ANALYTICS SUITE
Our Easy Analytics suite includes everything in the Free Market Data suite plus:
- Five additional years of historical data
- Import/Export data
- The ability to download the data in Excel format
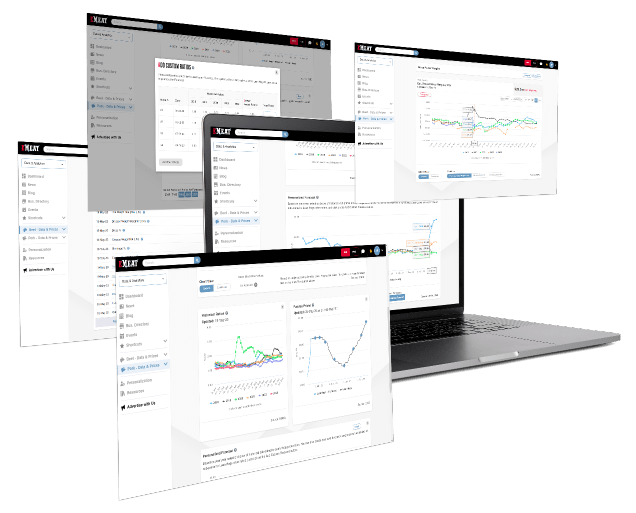
ADVANCED ANALYTICS SUITE
Everything in the Easy Analytics suite plus forecasting and risk management tools for the livestock and meat markets.
Take advantage of our 14-day Free Trial!
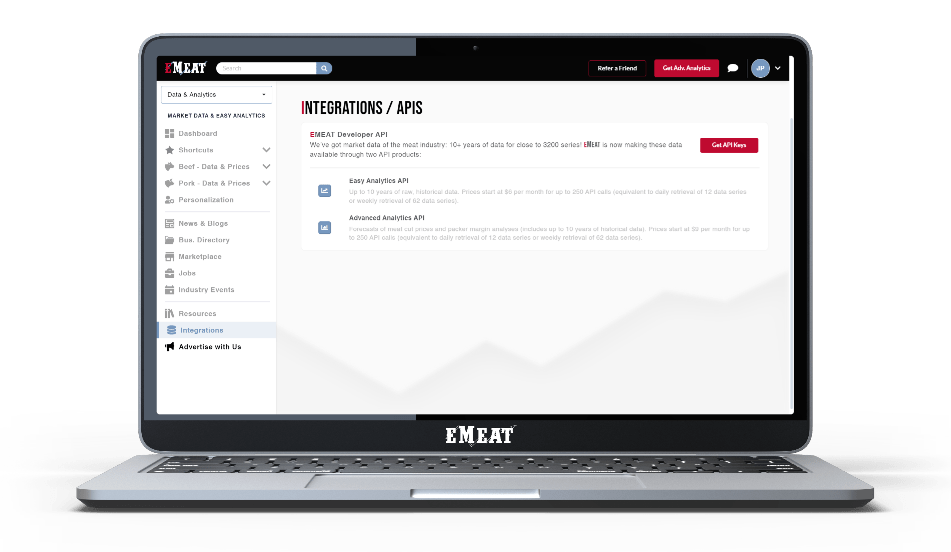
API PRODUCTS
Integrate our APIs into your company's systems for an effortless and efficient North American Meat Industry data analysis experience.
- For nearly 3,200 series, we offer 10+ years of market data in the meat industry
- Plans start at $8 per month
What our customers are saying

I would like to congratulate EMEAT and Simon for the development of a tool that provides accessibility and visibility to key data in a very user-friendly way. EMEAT incorporates user interaction and flexibility in a simple, innovative way. I find the cyclical vs. continuous chart view feature...
view more

Jose J. Montes
Managing Director at Monteli LLC
Meat prices during the first months of the COVID-19 pandemic reached unprecedented high levels. With EMEAT, it is not only easy to spot market trends but also perform various data analyses without having to download the data, which is very practical indeed.
Roberto Aguilar
General Manager at Santara
Sign Up and get access to EMEAT's market data, analytical tools, and insights.


Popular
About EMEAT
Advertise With Us
Copyright © 2021-2025. All rights reserved
This website stores cookies on your computer. These cookies are used to collect information about how you interact with our website and allow us to remember you. We use this information in order to improve and customize your browsing experience and for analytics and metrics about our visitors on this website. To find out more about the cookies we use, see ourPrivacy Policy.